オリジナルURL:New Seafloor Map Helps Scientists Find New Features
An international scientific team recently published a new map of the ocean floor based on Earth’s gravity field, and it is a particularly useful tool. The maps were created through computer analysis and modeling of new satellite data from ESA’s CryoSat-2 and from the NASA-CNES Jason-1, as well as older data from missions flown in the 1980s and 90s.
Image Credit: NASA Earth Observatory maps by Joshua Stevens, using data from Sandwell, D. et al. (2014)
Caption: Mike Carlowicz
国際科学チームは、地球の重力場に基づいて、新しい海底地図を発表し、実際それはとても役に立ちます。この地図は、ESAのCryoSat-2とNASA-CNESのJason-1からの新しい観測データをコンピュータ解析してモデリングの処理したものです。これは1980年代と90年代に海底地図を作成した時と同じような処理です。
(訳者注)NASAによると、実際に海底地図の作成を担当しているのは以下のメンバーです。
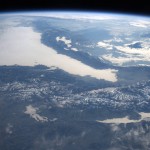
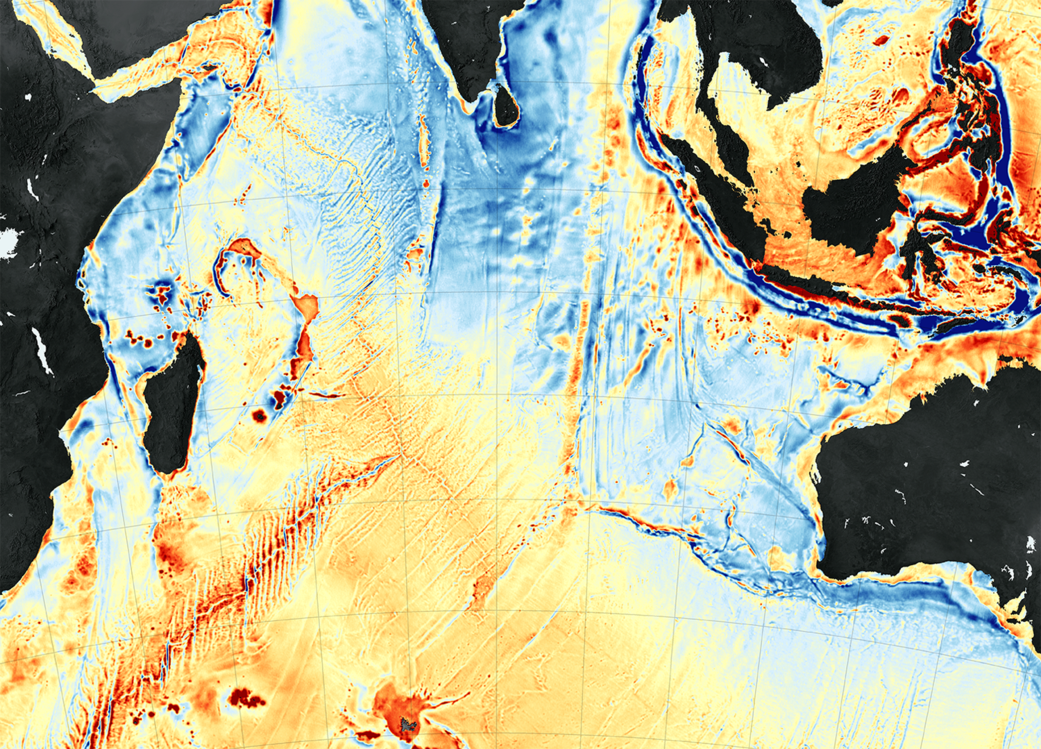
The map above shows seafloor gravity anomalies in the western Indian Ocean, as assembled by David Sandwell of the Scripps Institution of Oceanography, Walter Smith of the National Oceanic and Atmospheric Administration, and colleagues.
ここに掲載された海底地図は、ちょっとドギツイ色付きですが、西インド洋のものです。黒いところが地表で上部中央がインドです。左にアフリカ大陸、右にマレー半島やインドネシア諸島が見れます。
オレンジと赤で色付けされている部分は海底重力が他の地域より強い地域を表しています。逆に青い色は重力が低い部分で深い海底であることを示しています。