NASAの今日の1枚は、何の画像でしょうか?
記事を見ていくと、地球観測衛星が上空からコロナ(COVID-19)について観測しているとあります。
まさか、中国の武漢のウィルス研究所をNASAが空撮しているのか?と緊張を覚えましたが、そうではありませんでした。
新型コロナウィルス感染拡大対策で、都市がロックダウンされると、人や車の移動が無くなり地表温度の分布に変化が現れるということをNASAは伝えています。
NASAの公式サイトのURLはこちら:
Researching the Environment and COVID-19 | NASA
以下はオリジナル原文と和訳です。
Researching the Environment and COVID-19
Today is World Health Day and NASA’s Earth Science Division is using information from our Earth-observing satellites, surface sensors, and computer-based datasets to study the environmental, economic, and societal impacts of the COVID-19 pandemic and to determine whether environmental factors influence the spread of the virus.
今日は世界保健デーです。NASAの地球科学部門は、地球観測衛星に搭載している表面センサーによる電子データを用いて、COVID-19パンデミックの環境、経済、社会への影響を調査し、ウイルスの拡散に影響を与える環境用であるか否かを分析しています。
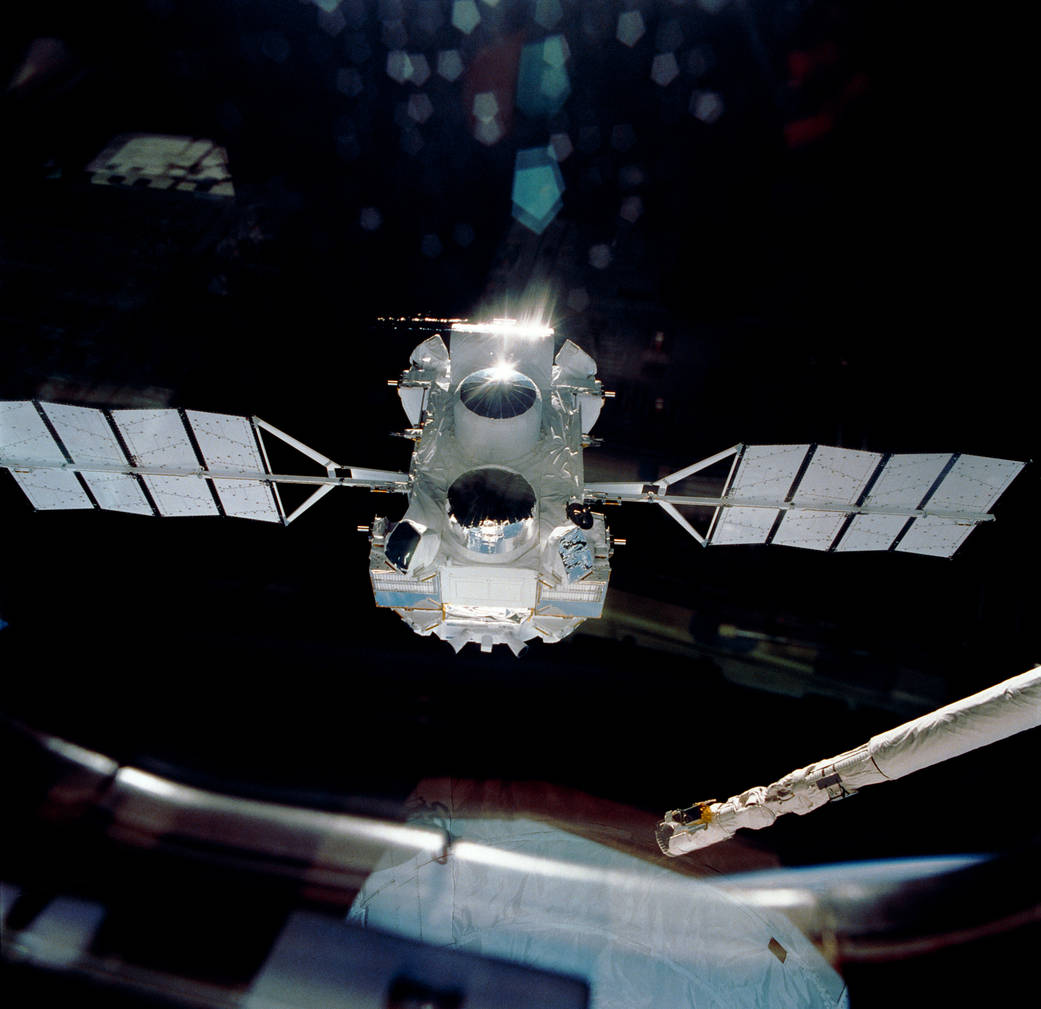
While scientists around the world often have been confined to their homes during the COVID-19 pandemic, Earth observing satellites continue to orbit and send back images that reveal connections between the pandemic and the environment. NASA began funding eight new projects last fall to look at COVID-19 and the environment.
COVID-19のパンデミックの間、世界中の科学者が自宅に閉じ込められることになりましたが、その間にも地球観測衛星はパンデミックと環境との関係を明らかにする画像を地球を周回しながら送り返し続けています。 NASAは、COVID-19と環境の相互関係を調べるために、昨年秋に8つの新しいプロジェクトへの資金提供を開始しました。
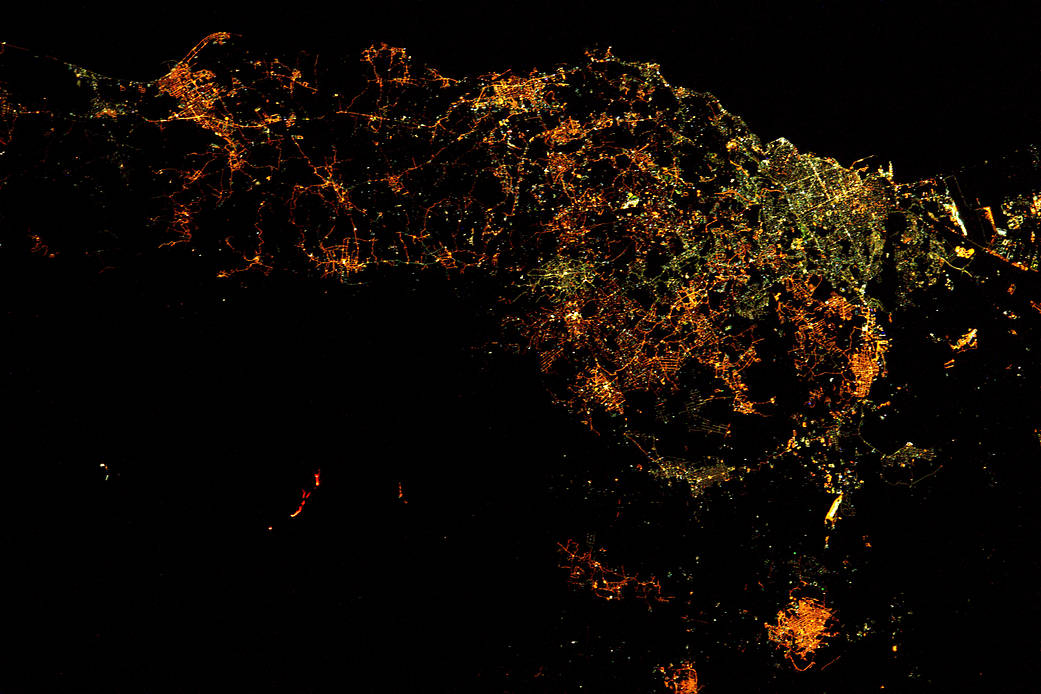
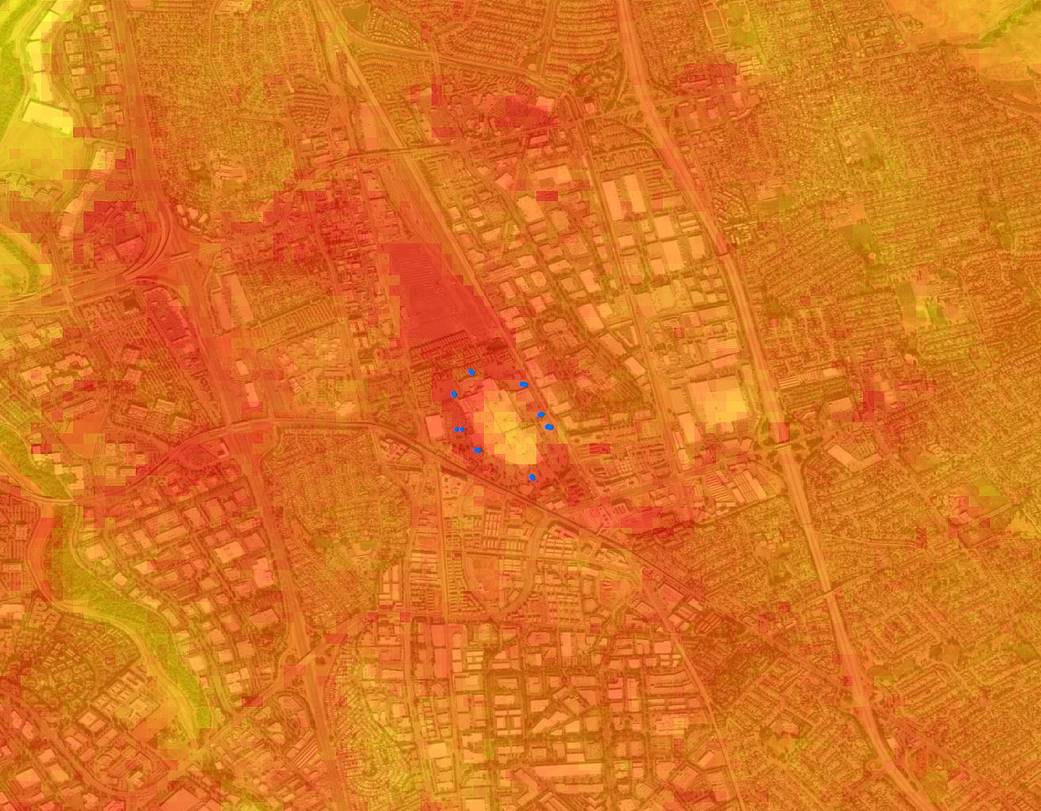
This image shows the ECOSTRESS land surface temperature variations measured on May 22, 2020, during the full lockdown period over an area centered on the Great Mall in Milpitas, California. Christopher Potter, a research scientist at Ames Research Center, is using such images to see how California’s shelter-in-place mandate in the San Francisco Bay Area has reduced the number of cars on the road and changed how parking lots, highways, and large industrial buildings’ surfaces absorb sunlight and reflect infrared heat.
この画像は、カリフォルニア州ミルピタスのグレートモールを中心とする地域で、完全な封鎖期間中である2020年5月22日に測定された地表面温度変動を示しています。エームズリサーチセンターの研究科学者であるクリストファーポッターは、このような画像を使用して、サンフランシスコベイエリアでのカリフォルニアの一時避難場所における、道路上の車の数の現象から駐車場、高速道路、および大規模駐車場、大型の工業施設が太陽光を吸収し赤外線熱の反射がどのように変化したかを分析しています。
Image Credit: Christopher Potter, NASA Ames Research Center
Last Updated: Apr 7, 2021
Editor: Yvette Smith
補足説明
上記のNASAの記事から、言っていることは何となくわかるにしても、具体的に今日の1枚の画像がどうなのかよくわかりません。
例えば中央部の青い丸は何を意味にしているのでしょうか?
この記事の関連先を辿ると、別に詳しい説明がありました。
This image shows the ECOSTRESS land surface temperature variations measured on May 22, 2020, during the full lockdown period over an area centered on the Great Mall in Milpitas. The blue dots represent ground truth measurements on May 22 in large vacant parking lots. The darkish reddish shades show the highest temperatures on dark asphalt parking lots and roadways, and the yellow-greenish shades indicate lower temperatures in parklands and semi-vegetated areas. Bright white rooftops are in the middle shades.
New Projects Explore Connections Between COVID-19 and the Environment | NASA
青い点は、大規模駐車場での測定値を表していて、濃い赤みがかった色はアスファルトの駐車場と道路で最も高い温度を示し、黄緑色がかった色は、緑地と半植生地でのより低い温度を示しています。真っ白な色は、建物の屋上ということです。